GPBR200 Design-Space Sensitivity Analysis
Contact: Zachary M. Prince, [email protected]
Model link: GPBR200 Sensitivity Analysis
The MOOSE stochastic tools module (STM) contains utilities and capabilities useful for stochastic simulation of MOOSE-based models (Slaughter et al., 2023). In this exposition, a sensitivity analysis is performed on the GPBR200 equilibrium core model using the STM. This is a analog to the sensitivity analysis performed in Section 3 of Prince et al. (2024). This analysis has four objectives:
Identify design parameters and QoIs (stm_base_sampling.i)
Perform qualitative sensitivity analysis (stm_grid_study.i)
Produce a training dataset (stm_lhs_sampling.i)
Compute global sensitivities (stm_poly_chaos.i)
Parameters and QoIs
Six parameters in the GPBR200 model were chosen to define the design-space and five quantities of interest (QoIs) were chosen for the analysis. The parameters are defined in Table 1 with a lower and upper bound describing their uniform probability distribution, as well as their nominal value for comparison. The QoIs are defined in Table 2 with their nominal values, which are the values as a result of evaluating the model at the parameters' nominal values.
Table 1: Design space for the GPBR200 model.
| Parameter | Nominal Value | Lower Bound | Upper Bound | Unit |
|---|---|---|---|---|
| Kernel radius | 0.2125 | 0.15 | 0.3 | mm |
| Filling factor | 9.34 | 5 | 15 | % |
| Enrichment | 15.5 | 5 | 20 | wt% |
| Feed rate | 1.5 | 1 | 3 | pebbles/min |
| Burnup limit | 147.6 | 131.2 | 164.0 | MWd/kg |
| Total power | 200 | 180 | 220 | MW |
Table 2: Quantities of interest for the GPBR200 model.
| QoI | Nominal Value | Unit |
|---|---|---|
| Eigenvalue | 1.00129 | — |
| Max fuel temperature | 1281 | K |
| Max RPV temperature | 508.5 | K |
| Max pebble power | 2.67 | kW |
| Peaking factor | 2.012 | — |
Modified GPBR200 Model
The fully-coupled GPBR200 equilibrium-core input is largely unchanged from that described in the previous step. The primary difference in the inclusion of postprocessors defining the QoIs and the removal of Outputs.
[Postprocessors]
  # Temperatures
  [Tfuel_max]
    type = ElementExtremeValue
    variable = Tfuel_max
    block = ${fuel_blocks}
  []
  [Trpv_max]
    type = ElementExtremeValue
    variable = T_solid
    block = 21
  []

  # Pebble power
  [ppd_max]
    type = ElementExtremeValue
    variable = ppd_max
    block = ${fuel_blocks}
    outputs = none
  []
  [pebble_power_max]
    type = ScalePostprocessor
    value = ppd_max
    scaling_factor = '${pebble_volume}'
  []

  # Reactor power
  [power_max]
    type = ElementExtremeValue
    variable = total_power_density
    block = ${fuel_blocks}
    outputs = none
  []
  [power_avg]
    type = ElementAverageValue
    variable = total_power_density
    block = ${fuel_blocks}
    outputs = none
  []
  [peaking_factor]
    type = ParsedPostprocessor
    expression = 'power_max / power_avg'
    pp_names = 'power_max power_avg'
  []
[]The other, more minor, modification is in the thermal hydraulics input, where dt_min and error_on_dtmin are specified. This insures that the stochastic simulation doesn't stall on a difficult-to-converge configuration and simply marks the sample as "uncoverged".
 @@ -1,30 +1,32 @@
 [Executioner]
   type = Transient
   solve_type = NEWTON
-  petsc_options_iname = '-pc_type'
-  petsc_options_value = 'lu'
+  petsc_options_iname = '-pc_type -sub_pc_factor_shift_type'
+  petsc_options_value = 'lu       NONZERO'
   line_search = l2

   # Scaling.
   automatic_scaling = true
   off_diagonals_in_auto_scaling = false
   compute_scaling_once = false

   # Tolerances.
   nl_abs_tol = 1e-5
   nl_rel_tol = 1e-6
   nl_max_its = 15

   # Time step control.
   [TimeStepper]
     type = IterationAdaptiveDT
     dt = 2.5e-3
     cutback_factor = 0.5
     growth_factor = 2.00
     optimal_iterations = 8
   []

   # Steady state detection.
   steady_state_detection = true
   steady_state_tolerance = 1e-13
+  error_on_dtmin = false
+  dtmin = 1e-6
[](+ htgr/gpbr200/sensitivity_analysis/gpbr200_ss_phth_reactor.i)
Base Sampling Input
This input defines most of the objects necessary for sampling the GPBR200 model and gathering the QoIs. First, input file variables are specified defining the upper and lower bounds of the design-space parameters.
The parameter bounds and nominal values are defined in the relevant input files of the model:
# Kernel radius (m) ------------------------------------------------------------
kernel_radius_min = 1.5e-4
kernel_radius_max = 3.0e-4

# Filling factor ---------------------------------------------------------------
filling_factor_min = 0.05
filling_factor_max = 0.15

# Enrichment -------------------------------------------------------------------
enrichment_min = 0.05
enrichment_max = 0.2

# Pebble unloading rate (pebbles per second) -----------------------------------
pebble_unloading_rate_min = '${fparse 1.0/60}'
pebble_unloading_rate_max = '${fparse 3.0/60}'

# Burnup limit (MWD/kg) --------------------------------------------------------
burnup_limit_weight_min = 131.2 # MWd / kg
burnup_limit_weight_max = 164 # MWd / kg

# Total power (W) --------------------------------------------------------------
total_power_min = 180e6
total_power_max = 220e6The STM utilizes the MultiApps system to perform the sampling, namely with SamplerFullSolveMultiApp. In this block, the GPBR200 input is specified; along with the sampler defining the parameter values of all the configurations to be sampled (this object will be defined in the next two sections). The mode and min_procs_per_app parameters specify the method in which the multiapps are distributed, i.e. only one app per four processors available are instantiated at time; this minimizes the number of HPC nodes the execution needs to allocate. The ignore_solve_not_converge parameter allows the sampling to continue even if one of the sample's solve fails to converge.
[MultiApps]
  [sub]
    type = SamplerFullSolveMultiApp
    input_files = gpbr200_ss_gfnk_reactor.i
    sampler = sample
    mode = batch-reset
    min_procs_per_app = 4
    ignore_solve_not_converge = true
  []
[]Next, a Controls object is specified, which takes the configurations defined by the sampler and applies them as command-line arguments when instantiating the sub-applications.
[Controls]
  [param]
    type = MultiAppSamplerControl
    sampler = sample
    multi_app = sub
    param_names = 'kernel_radius
                   filling_factor
                   enrichment
                   pebble_unloading_rate
                   burnup_limit_weight
                   total_power'
  []
[]Next, a StochasticMatrix reporter is specified, which serves as a storage object that contains all the parameters and resulting QoIs for each configuration. This eventually gets outputted as a CSV file.
[Reporters]
  [storage]
    type = StochasticMatrix
    sampler = sample
    sampler_column_names = 'kernel_radius
                            filling_factor
                            enrichment
                            pebble_unloading_rate
                            burnup_limit_weight
                            total_power'
    parallel_type = ROOT
  []
[]Finally, a Transfers object is specified for extracting the postprocessors from the sub-applications and filling in the storage reporter.
[Transfers]
  [data]
    type = SamplerReporterTransfer
    from_multi_app = sub
    sampler = sample
    stochastic_reporter = storage
    from_reporter = 'eigenvalue/value
                     Tfuel_max/value
                     Trpv_max/value
                     pebble_power_max/value
                     peaking_factor/value'
  []
[]1D Grid Study
The goal of this input is to perform a qualitative analysis on how each parameter impacts each quantity of interest individually. The method utilizes a Cartesian1D sampler to sample each parameter at 12 equidistant points between their upper and lower bound, while keeping all other parameters the same. The resulting number of samples is .
!include stm_base_sampling.i

# Nominal parameter values -----------------------------------------------------
kernel_radius = 2.1250e-04
filling_factor = 0.0934404551647307 # Particle filling factor
enrichment = 0.155 # Enrichment in weight fraction
pebble_unloading_rate = '${fparse 1.5/60}' # pebbles per minute / seconds per minute.
burnup_limit_weight = 147.6 # MWd / kg
total_power = 200.0e+6 # Total reactor Power (W)

# Grid stepping ----------------------------------------------------------------
ngrid = 12
kernel_radius_step = '${fparse (kernel_radius_max - kernel_radius_min) / (ngrid - 1)}'
filling_factor_step = '${fparse (filling_factor_max - filling_factor_min) / (ngrid - 1)}'
enrichment_step = '${fparse (enrichment_max - enrichment_min) / (ngrid - 1)}'
pebble_unloading_rate_step = '${fparse (pebble_unloading_rate_max - pebble_unloading_rate_min) / (ngrid - 1)}'
burnup_limit_weight_step = '${fparse (burnup_limit_weight_max - burnup_limit_weight_min) / (ngrid - 1)}'
total_power_step = '${fparse (total_power_max - total_power_min) / (ngrid - 1)}'

[Samplers]
  [sample]
    type = Cartesian1D
    nominal_values = '${kernel_radius} ${filling_factor} ${enrichment} ${pebble_unloading_rate} ${burnup_limit_weight} ${total_power}'
    linear_space_items = '${kernel_radius_min} ${kernel_radius_step} ${ngrid}
                          ${filling_factor_min} ${filling_factor_step} ${ngrid}
                          ${enrichment_min} ${enrichment_step} ${ngrid}
                          ${pebble_unloading_rate_min} ${pebble_unloading_rate_step} ${ngrid}
                          ${burnup_limit_weight_min} ${burnup_limit_weight_step} ${ngrid}
                          ${total_power_min} ${total_power_step} ${ngrid}'
    min_procs_per_row = 4
    execute_on = PRE_MULTIAPP_SETUP
  []
[]
Running this input requires the use of a blue_crab-opt executable. Each sample takes an average of 10 min to complete on 4 processors. Figure 1 shows the dependency each parameter has on each QoI. Note that the parameters are scaled based on nominal values and lower and upper bounds.
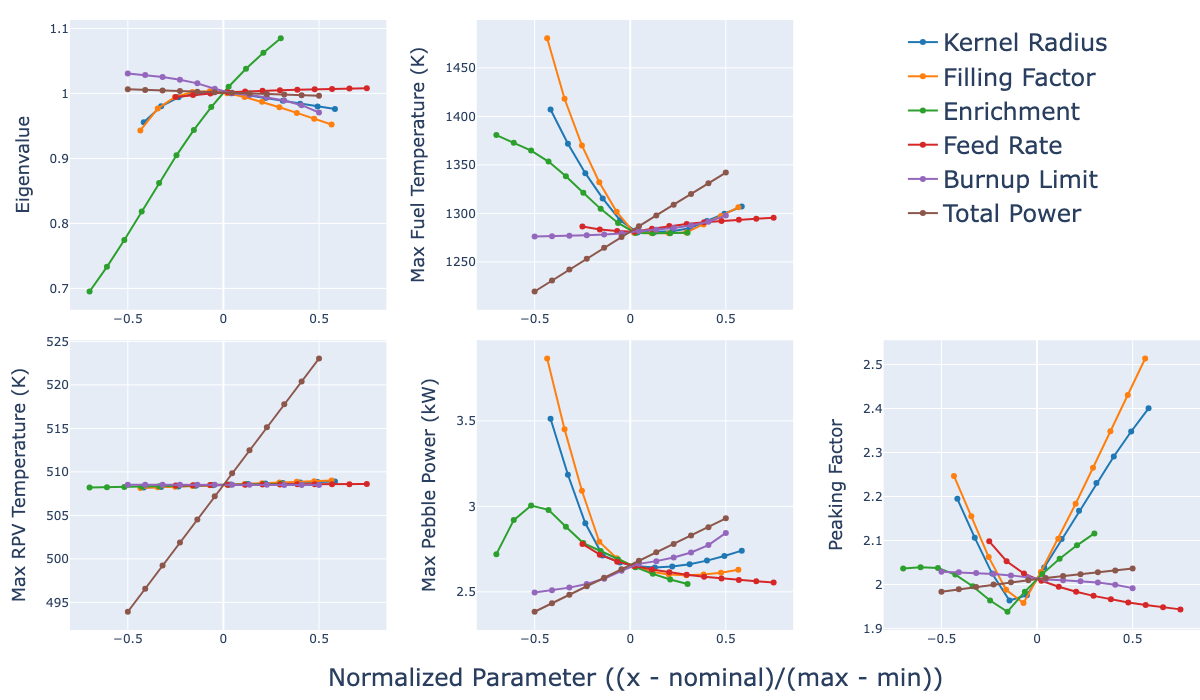
Figure 1: Quantities of interest versus design parameters from performing one-dimensional grid sampling.
Random Sampling
The purpose of this next input is essentially to generate a lot of data. This data will be used in the next section to perform global sensitivity analysis. This is done by specifying a LatinHypercube sampler, which evaluates the parameter Distributions' quantile to generate 10,000 random configurations of the model.
!include stm_base_sampling.i

[Distributions]
  [kr]
    type = Uniform
    lower_bound = ${kernel_radius_min}
    upper_bound = ${kernel_radius_max}
  []
  [ff]
    type = Uniform
    lower_bound = ${filling_factor_min}
    upper_bound = ${filling_factor_max}
  []
  [enrich]
    type = Uniform
    lower_bound = ${enrichment_min}
    upper_bound = ${enrichment_max}
  []
  [pur]
    type = Uniform
    lower_bound = ${pebble_unloading_rate_min}
    upper_bound = ${pebble_unloading_rate_max}
  []
  [bul]
    type = Uniform
    lower_bound = ${burnup_limit_weight_min}
    upper_bound = ${burnup_limit_weight_max}
  []
  [power]
    type = Uniform
    lower_bound = ${total_power_min}
    upper_bound = ${total_power_max}
  []
[]

[Samplers]
  [sample]
    type = LatinHypercube
    distributions = 'kr ff enrich pur bul power'
    num_rows = 10000
    min_procs_per_row = 4
    execute_on = PRE_MULTIAPP_SETUP
  []
[]
This input takes, by far, the most time and computing resources of any input involving this model. The average run-time for each sample is 13 min; as a result, running this input on 448 processors (four nodes on INL's Bitterroot HPC) took about 24 hours. Figure 2 shows the resulting discrete probability distributions for each QoI.
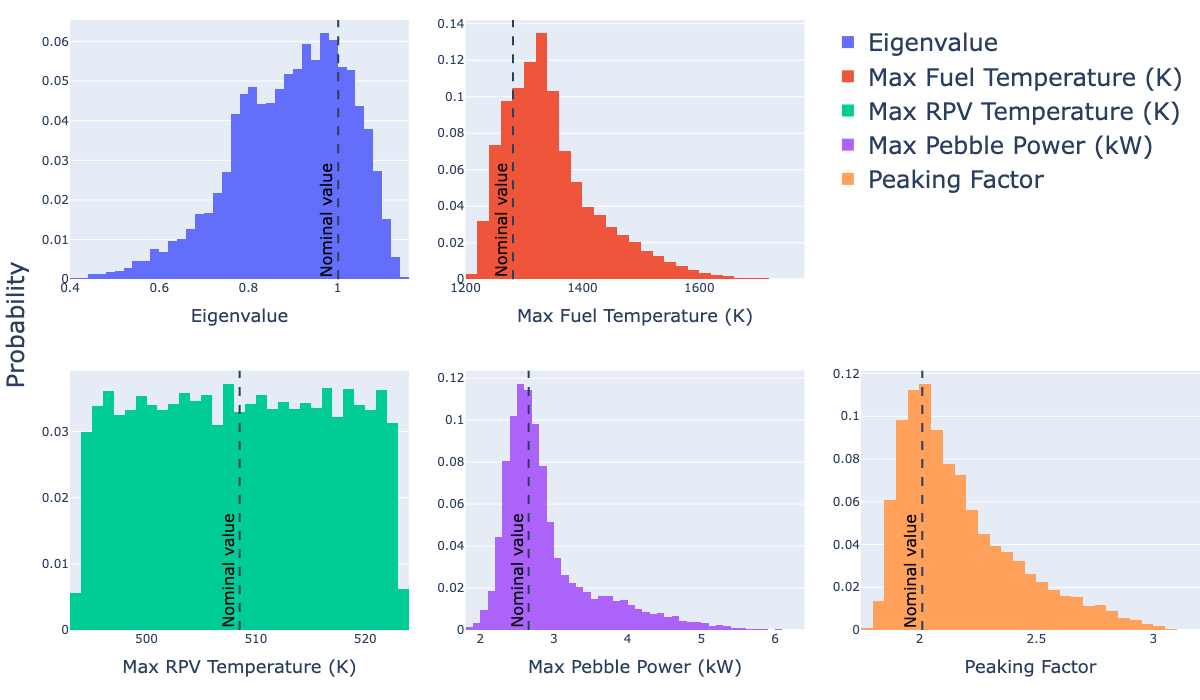
Figure 2: Discrete probability density functions of quantities of interest from Latin hypercube sampling.
Global Sensitivity Analysis
The final aspect of this demonstrative model is to use the data from previous section and evaluate Sobol indices using a polynomial chaos expansion (PCE) methodology. PCE is a surrogate modeling technique that has convenient feature for computing Sobol indices, for more details see Section 3.4 in Prince et al. (2024). The first part of this input involves loading the CSV data from the sampling run; the parameter data is loaded into a CSVSampler and the rest is loading into a CSVReaderVectorPostprocessor. Note that this data was processed with the following python commands to remove unconverged samples.
>>> import pandas as pd
>>> df = pd.read_csv("stm_lhs_sampling_out_storage_0001.csv")
>>> df = df.loc[df["data:converged"] == True]
>>> df.to_csv("stm_lhs_sampling_processed.csv", index=False)
[Samplers]
  [params]
    type = CSVSampler
    samples_file = stm_lhs_sampling_processed.csv
    column_names = 'kernel_radius
                    filling_factor
                    enrichment
                    pebble_unloading_rate
                    burnup_limit_weight
                    total_power'
  []
[]

[VectorPostprocessors]
  [qois]
    type = CSVReaderVectorPostprocessor
    csv_file = stm_lhs_sampling_processed.csv
  []
[]Next, Trainers are defined to train a fourth-order polynomial chaos expansion for each QoI using ordinary least-squares. Note the distributions from the sampling phase are required in order to select the optimal expansion bases.
[GlobalParams]
  sampler = params
  distributions = 'kr ff enrich pur bul power'
  order = 4
  regression_type = ols
[]

[Trainers]
  [train_eigenvalue]
    type = PolynomialChaosTrainer
    response = 'qois/data:eigenvalue:value'
    execute_on = timestep_begin
  []
  [train_pebble_power_max]
    type = PolynomialChaosTrainer
    response = 'qois/data:pebble_power_max:value'
    execute_on = timestep_begin
  []
  [train_peaking_factor]
    type = PolynomialChaosTrainer
    response = 'qois/data:peaking_factor:value'
    execute_on = timestep_begin
  []
  [train_Tfuel_max]
    type = PolynomialChaosTrainer
    response = 'qois/data:Tfuel_max:value'
    execute_on = timestep_begin
  []
  [train_Trpv_max]
    type = PolynomialChaosTrainer
    response = 'qois/data:Trpv_max:value'
    execute_on = timestep_begin
  []
[]Next, Surrogates for each QoI's PCE is specified.
[Surrogates]
  [model_eigenvalue]
    type = PolynomialChaos
    trainer = train_eigenvalue
  []
  [model_pebble_power_max]
    type = PolynomialChaos
    trainer = train_pebble_power_max
  []
  [model_peaking_factor]
    type = PolynomialChaos
    trainer = train_peaking_factor
  []
  [model_Tfuel_max]
    type = PolynomialChaos
    trainer = train_Tfuel_max
  []
  [model_Trpv_max]
    type = PolynomialChaos
    trainer = train_Trpv_max
  []
[]These Surrogates are used by a PolynomialChaosReporter to evaluate the first, second, and total Sobol indices.
[Reporters]
  [stats]
    type = PolynomialChaosReporter
    pc_name = 'model_eigenvalue
               model_pebble_power_max
               model_peaking_factor
               model_Tfuel_max
               model_Trpv_max'
    statistics = 'mean stddev'
    include_sobol = true
  []
[]Finally, the indices computed in the reporter are outputted via a JSON file.
[Outputs]
  json = true
  execute_on = timestep_end
[]This input can be run with any MOOSE executable that contains the STM, including moose-opt, griffin-opt, and blue_crab-opt. The run-time is essentially instantaneous on a single processor. Figure 3 shows the resulting total Sobol indices for each parameter-QoI pair.
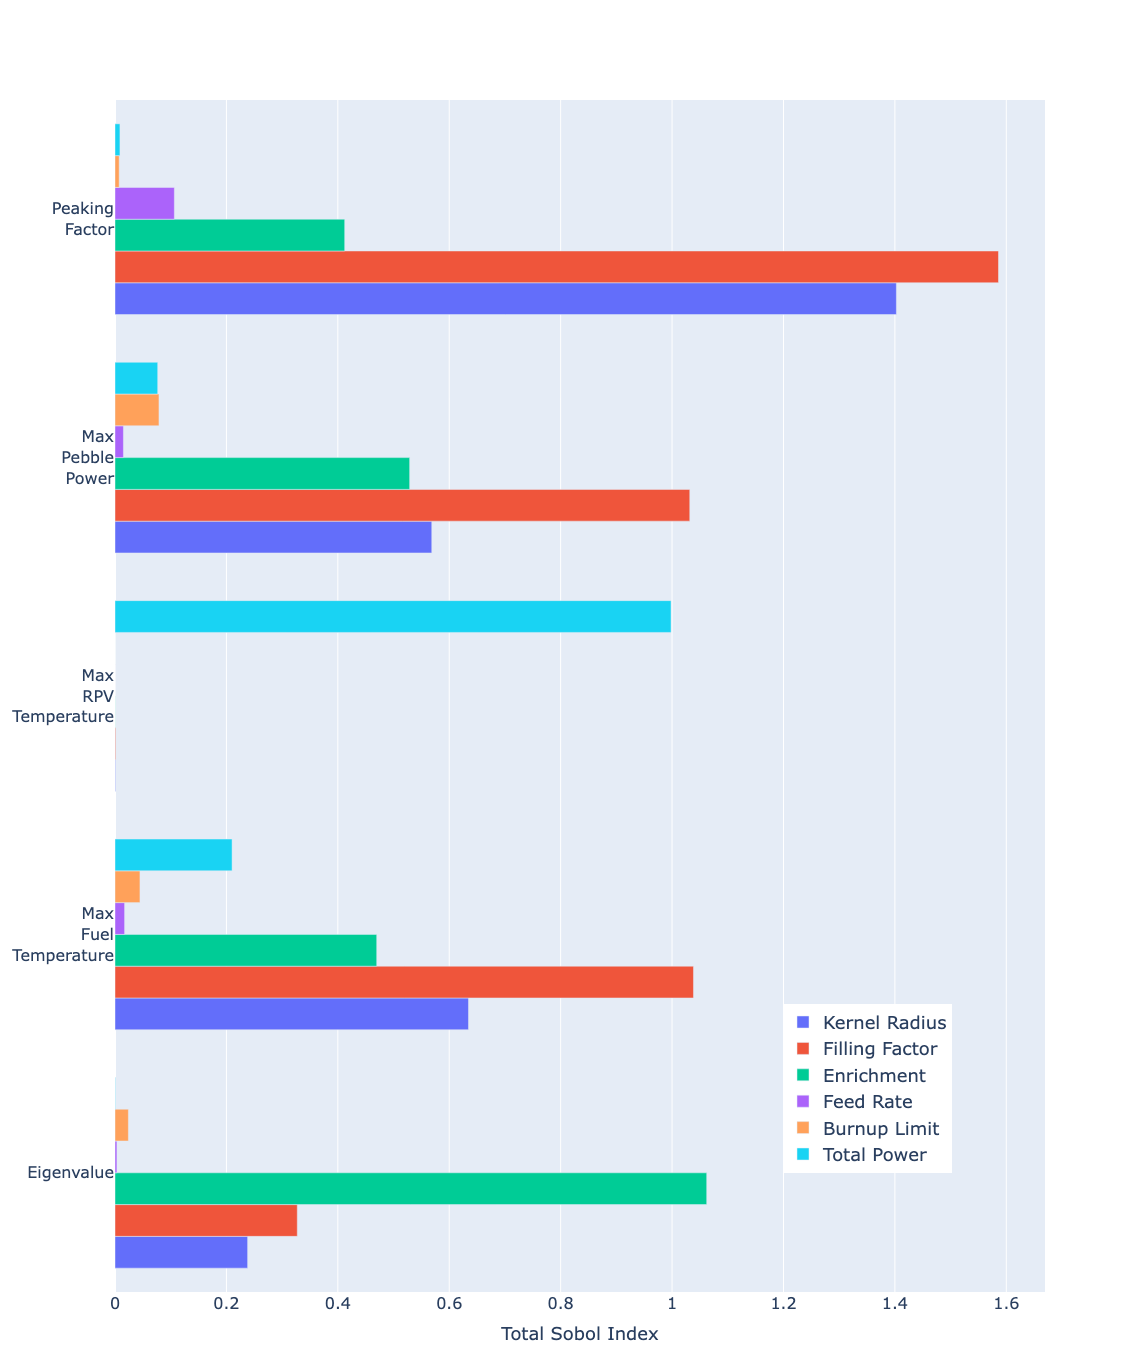
Figure 3: Total Sobol indices for each parameter and QoI calculated from polynomial chaos surrogate.
References
- Zachary M. Prince, Paolo Balestra, Javier Ortensi, Sebastian Schunert, Olin Calvin, Joshua T. Hanophy, Kun Mo, and Gerhard Strydom.
Sensitivity analysis, surrogate modeling, and optimization of pebble-bed reactors considering normal and accident conditions.
Nuclear Engineering and Design, 428:113466, 2024.
doi:https://doi.org/10.1016/j.nucengdes.2024.113466.[Export]
- Andrew E Slaughter, Zachary M Prince, Peter German, Ian Halvic, Wen Jiang, Benjamin W Spencer, Somayajulu L N Dhulipala, and Derek R Gaston.
MOOSE Stochastic Tools: A module for performing parallel, memory-efficient in situ stochastic simulations.
SoftwareX, 22:101345, 2023.
doi:10.1016/j.softx.2023.101345.[Export]