Na-HPMR Multiphysics Results
Multiphysics analysis was completed in the 1/6 core HP-MR model for the steady state operation of the Na-HPMR by coupling the Griffin high-fidelity neutronics with CFEM-SN(1,3) neutronics solver, the BISON heat conduction model, and the Sockeye heat-pipe performance model. In this section, the simulation results are discussed.
Steady State Results
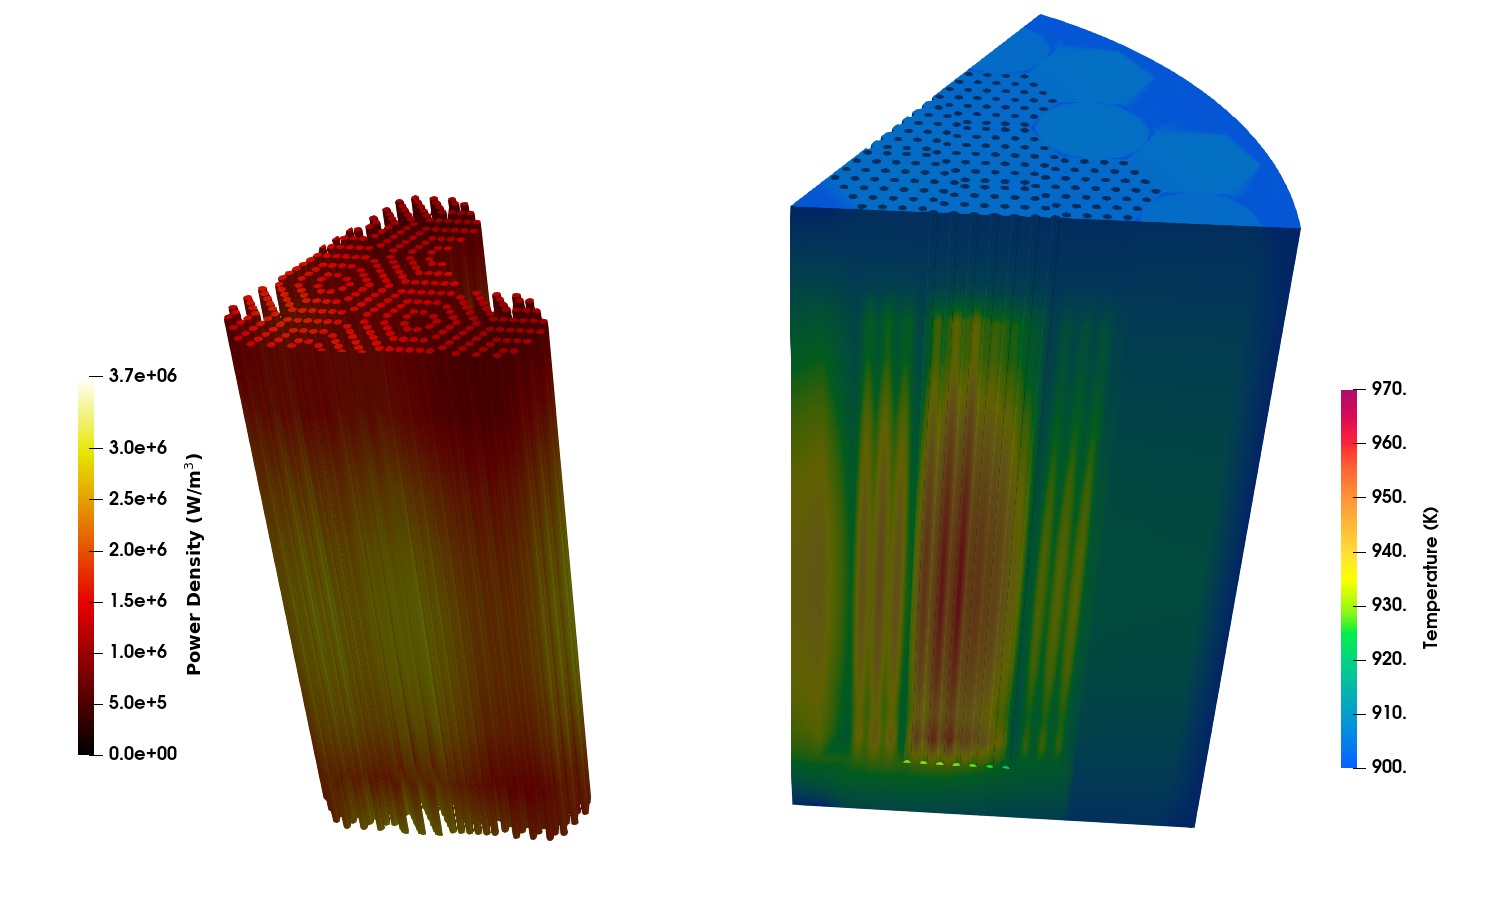
Figure 1: Steady state operation conditions as predicted by the Na-HPMR multiphysics model.
At the nominal power of ~2.07 MW, the Griffin-BISON-Sockeye model predicts the steady state operating conditions shown in Figure 1 with key parameters summarized in Table 1
Table 1: Key Na-HPMR operating parameters at steady state at nominal power
| Parameter | Unit | Value |
|---|---|---|
| Thermal Power (1/6 core) | kW | 345.6 |
| Avg. Fuel Temperature | K | 935.9 |
| Max. Fuel Temperature | K | 957.3 |
| Min. Fuel Temperature | K | 910.2 |
| Avg. Moderator Temperature | K | 935.2 |
| Max. Moderator Temperature | K | 954.4 |
| Min. Moderator Temperature | K | 910.5 |
| n/a | 1.048428 |
Load Following Transient Results
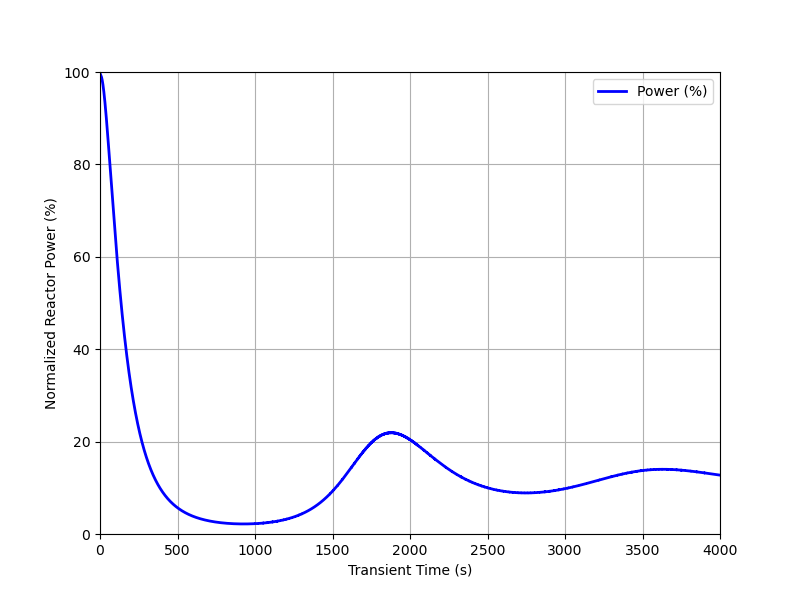
Figure 2: Time evolution of reactor power during a load following transient.
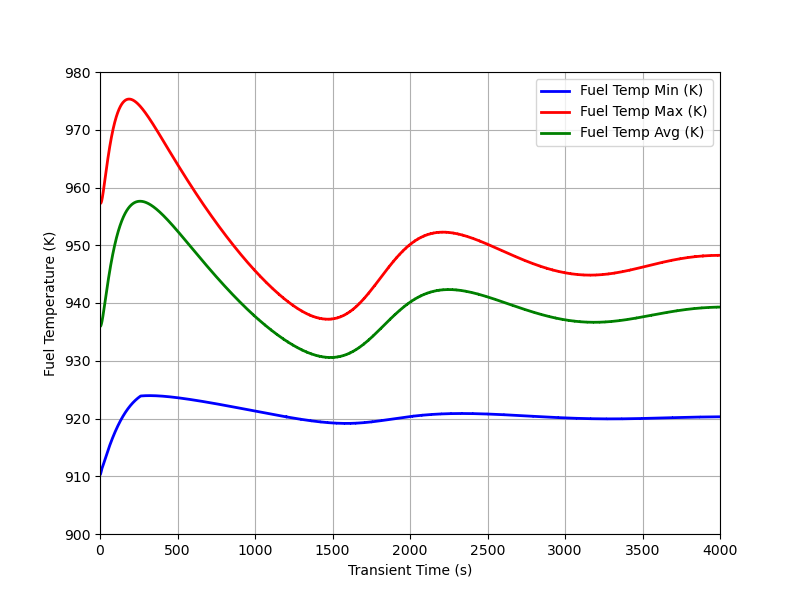
Figure 3: Time evolution of representative fuel temperatures during a load following transient.
The model predicts that an abrupt reduction in heat removal capability triggers an immediate rise in core temperature. As illustrated in Figure 3, the average fuel temperature increases by ~25 K within several hundred seconds, with the maximum fuel temperature peaking near 975 K. The resulting negative reactivity feedback drives a rapid decline in reactor power (see Figure 2), falling below 5% of its initial steady-state value within 1,000 seconds. This power reduction subsequently cools the core below its initial steady-state temperature, prompting a power rebound that peaks at approximately 23% near 1,800 seconds after the initiation of the event. As temperatures rise again, power once more decreases. A second power rebound, peaking at ~17%, occurs at approximately 3,600 seconds. These oscillations are expected to continue with diminishing amplitude until the system reaches a new, lower-power equilibrium. These results are consistent with prior K‑HPMR studies utilizing the effective-conductance heat-pipe model.
Startup Transient Results
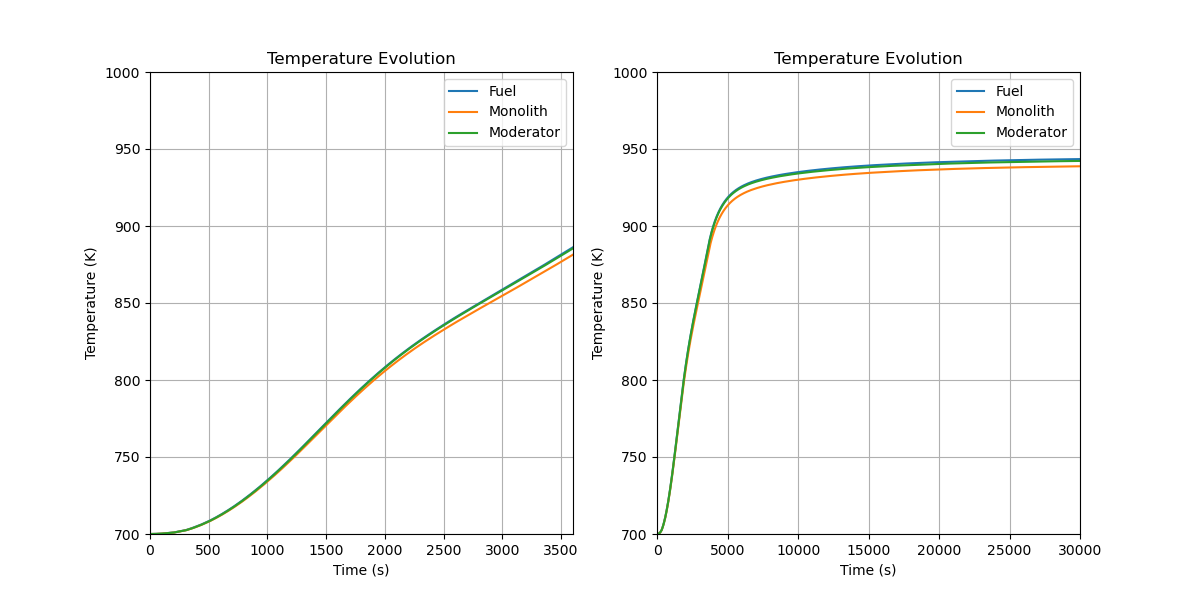
Figure 4: Time evolution of the calculated average temperatures of different reactor components during the startup.
As predicted by the multiphysics model, during HPMR startup, the thermal evolution of three representative HPMR components is shown in Figure 4. Reactor temperatures initially rise rapidly while the heat pipes remain inactive. At approximately 2,000-2,500 seconds, the rate of increase slows, signaling full heat pipes activation. Temperatures subsequently approach asymptotic values several hours after the power ramping concludes at 3,600 seconds.
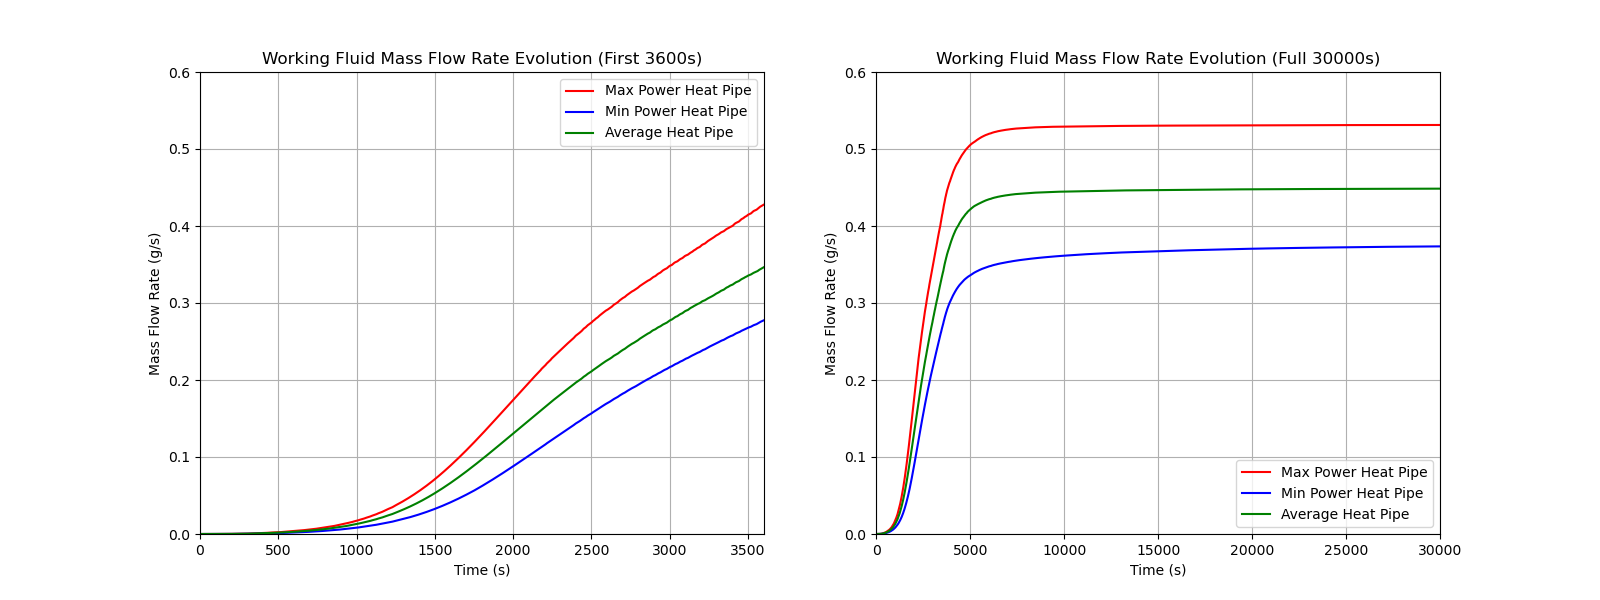
Figure 5: Time evolution of startup mass flow rate for the two representative heat pipes along with the average heat pipe behavior.
The mass flow rate evolution of representative heat pipes (see Figure 5) corroborates these trends: the mass flow rate begins to rise at approximately 500 seconds and its ramping rate saturates at approximately 2,000-2,500 seconds, coinciding with the temperature change observed in Figure 4. This behavior is further validated by the heat removal rates shown in Figure 6. Overall, this work demonstrates that the Sockeye heat pipe model can be successfully coupled with neutronics and solid heat conduction physics applications to create a full-core multiphysics HPMR model capable of capturing complex startup transients.
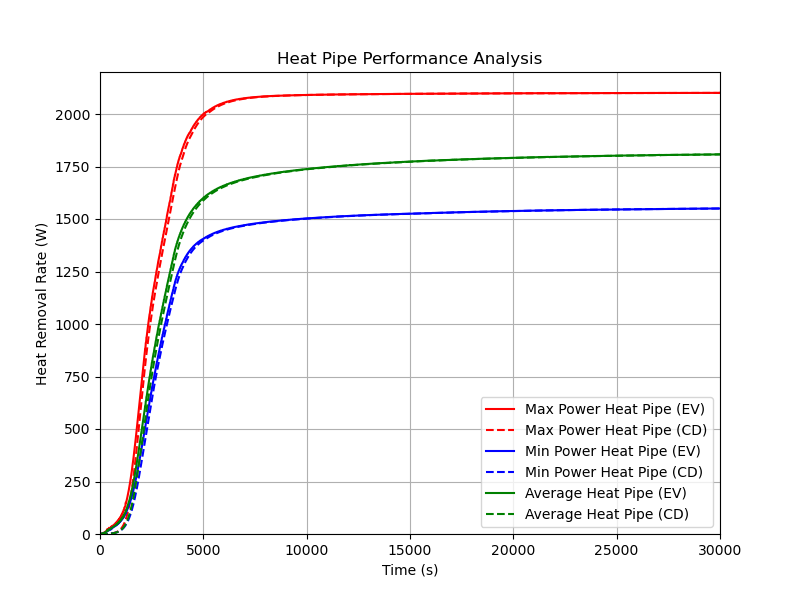
Figure 6: Time evolution of heat removal rate for the two representative heat pipes along with the average heat pipe behavior.